Preparing a public data reference panel from 1000 genomes project for PCA
Last update: 20240807
Table of contents
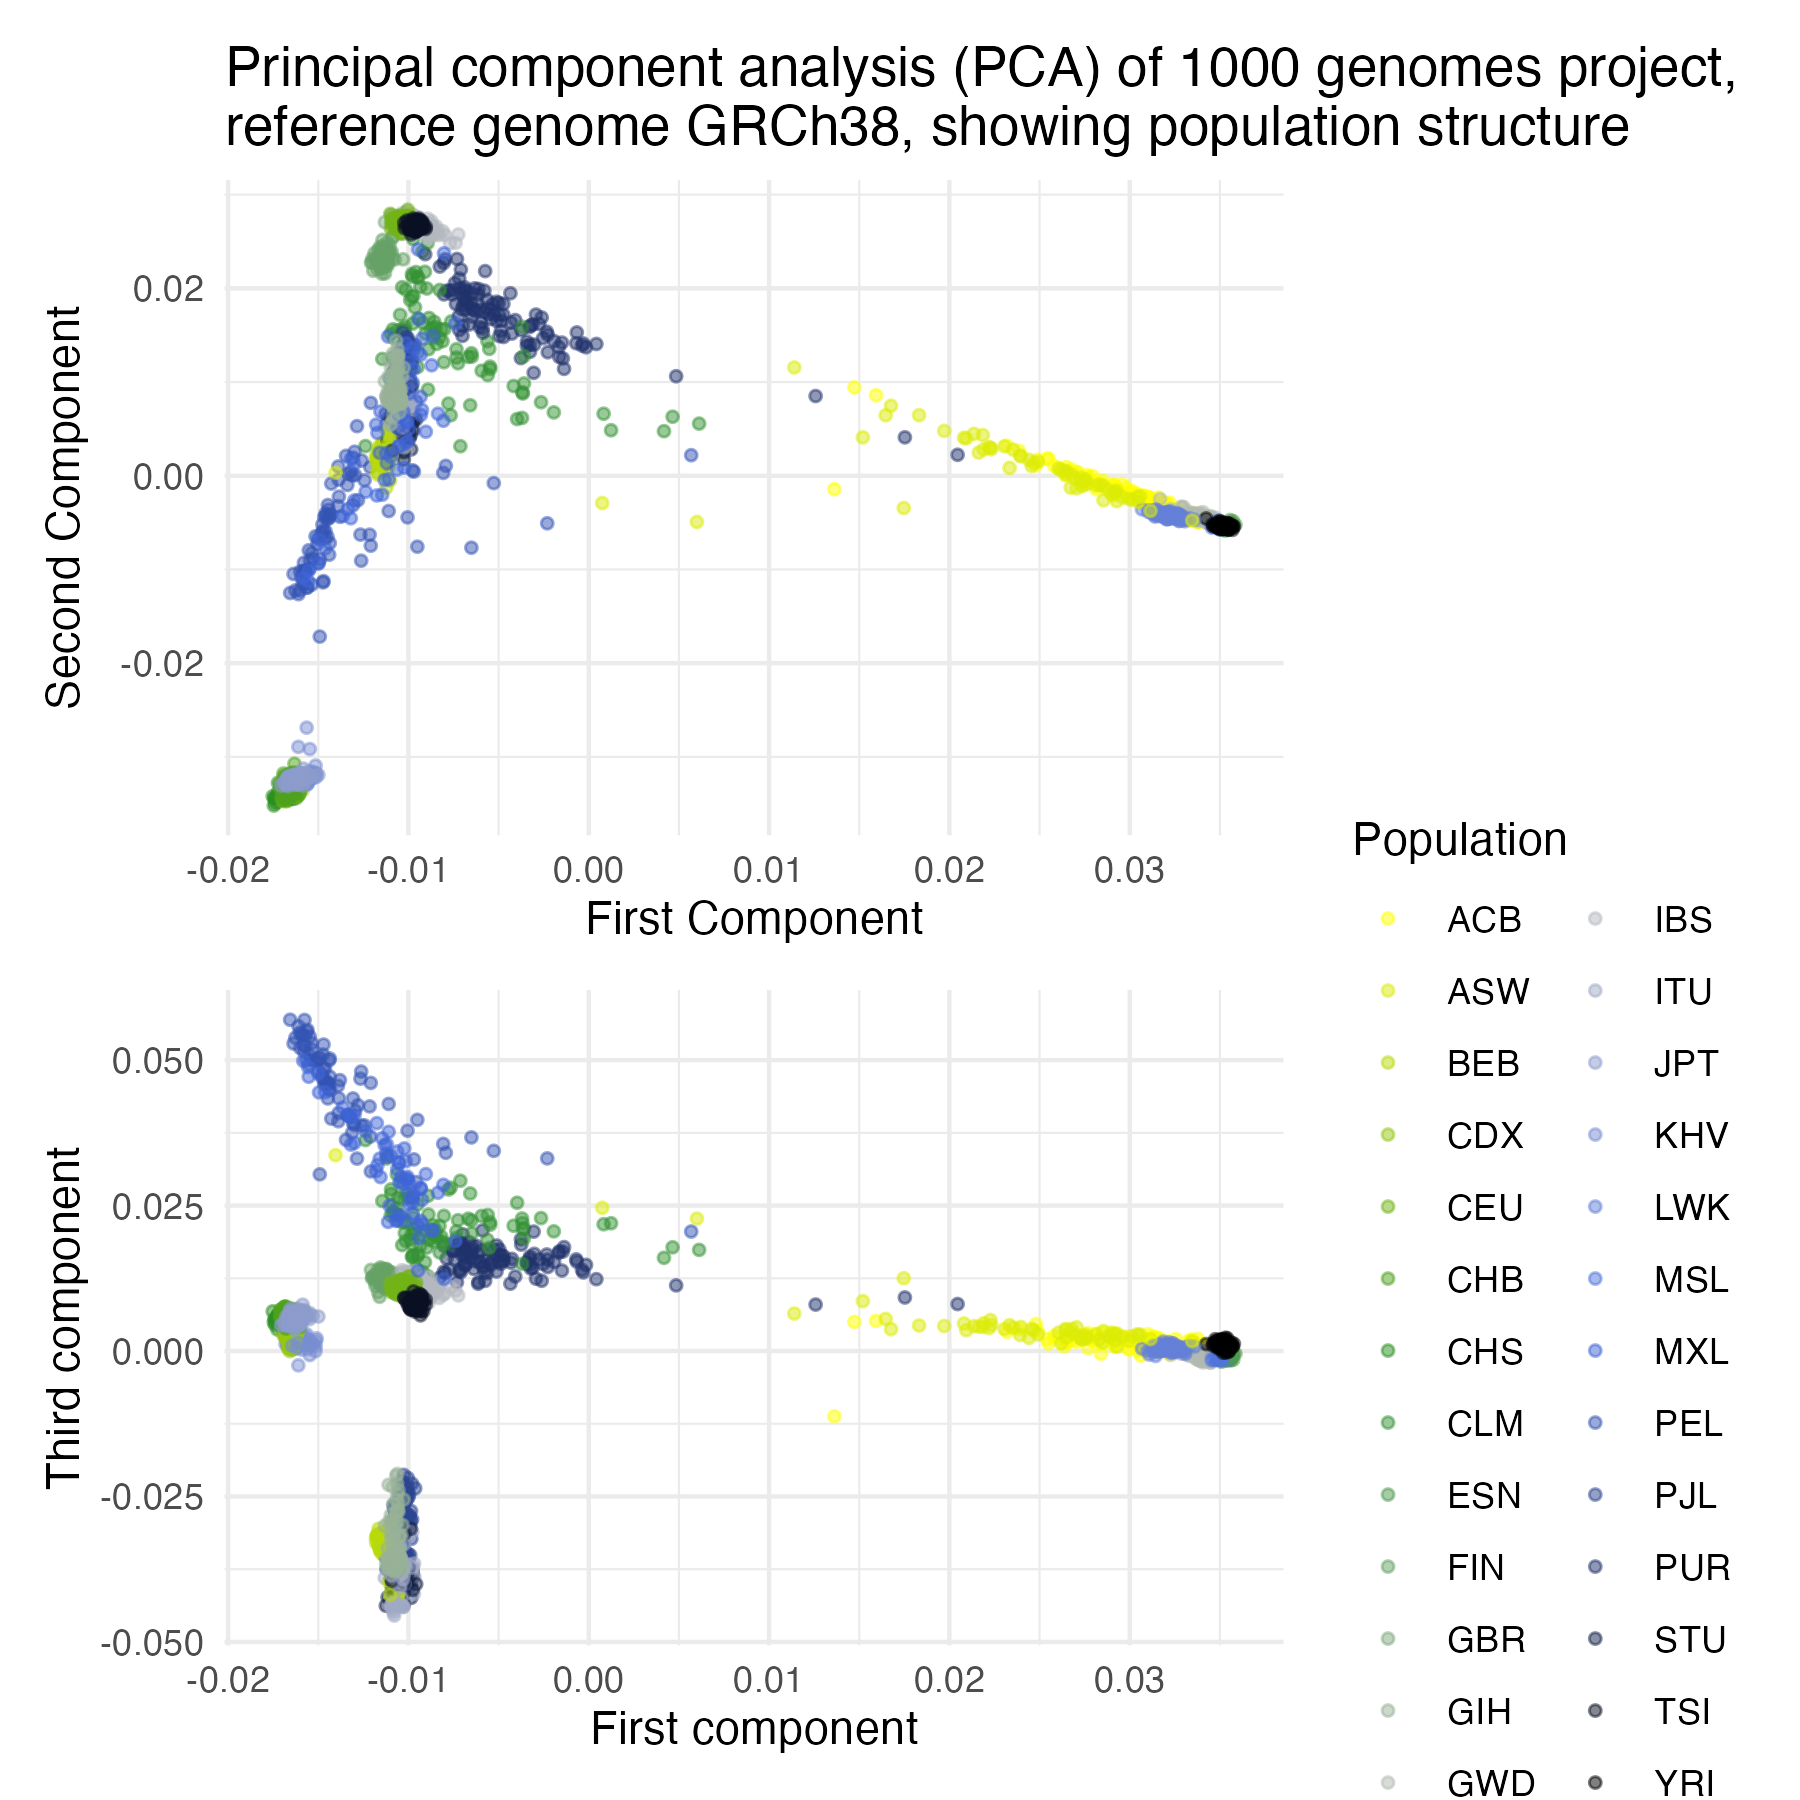 Figure 1: Principal component analysis (PCA) of 1000 genomes project, reference genome GRCh38, showing population structure.
Overview
This documentation outlines the process of preparing a reference panel using the 1000 Genomes Project data, focusing on converting data to PLINK format and performing Principal Component Analysis (PCA). This enables mapping of cohort data to determine population labels and provides a reference for genetic diversity analysis.
Data Source
The data utilized is derived from the GRCh38 release of the 1000 Genomes Project, specifically from:
- 1000 Genomes Project - GRCh38:
- http://ftp.1000genomes.ebi.ac.uk/vol1/ftp/data_collections/1000_genomes_project/release/20190312_biallelic_SNV_and_INDEL/
Tools and tutorials referenced
- Kevin Blighe’s Biostar Tutorial: “Produce PCA bi-plot for 1000 Genomes Phase III - Version 2” available at Biostars https://www.biostars.org/p/335605/.
- 1000 genomes project: Homepage https://www.internationalgenome.org
1000 genomes project
This is a project which provides public WGS data in VCF format and related metadata. The pedigree informaiton comes from 20130606_g1k.ped. We used the GRCh38 liftover data set http://ftp.1000genomes.ebi.ac.uk/vol1/ftp/data_collections/1000G_2504_high_coverage/working/phase3_liftover_nygc_dir/.
The phase 3 variant calls released by the 1000 Genomes project was on GRCh37 reference. To be able to compare them with the variant calls on the high coverage data they had to be lifted over to GRCh38. The liftover was performed at New York Genome Center (NYGC) using CrossMap version 0.5.4. The GRCh37 phase 3 calls used in the liftover are available here, ftp://ftp.1000genomes.ebi.ac.uk/vol1/ftp/release/20130502/. The chain file used in liftover is available at UCSC and can be downloaded from https://hgdownload.cse.ucsc.edu/goldenpath/hg19/liftOver/ .
We did not attempt to liftover SVs that were in phase 3. CrossMap does not liftover any records that either had multiple hits on GRCh38 or after liftover the REF allele matches ALT allele. Additionally, we failed any record that was lifted over to a different chromosome or if the REF allele contained symbols (Y, W, Z etc.).
[1] Download the files as VCF.gz (and tab-indices).
#!/bin/bash
prefix="ftp://ftp.1000genomes.ebi.ac.uk/vol1/ftp/data_collections/1000G_2504_high_coverage/working/phase3_liftover_nygc_dir/phase3.chr" ;

suffix=".GRCh38.GT.crossmap.vcf.gz" ;

for chr in {1..22} X Y; do
    wget "${prefix}""${chr}""${suffix}" \
               "${prefix}""${chr}""${suffix}".tbi ;
done

wget ftp://ftp.1000genomes.ebi.ac.uk/vol1/ftp/data_collections/1000G_2504_high_coverage/working/phase3_liftover_nygc_dir/phase3.crossmap.GRCh38.07302021.README.html
wget ftp://ftp.1000genomes.ebi.ac.uk/vol1/ftp/data_collections/1000G_2504_high_coverage/working/phase3_liftover_nygc_dir/phase3.crossmap.GRCh38.07302021.manifest.tsv

mkdir 1000genomes
mv phase3* 1000genomes/
[2] Download 1000 Genomes PED file. wget ftp://ftp.1000genomes.ebi.ac.uk/vol1/ftp/technical/working/20130606_sample_info/20130606_g1k.ped
[3] Download (link to the existing copy) of the reference genome.
Read here: Reference genome.
Pedigree data
| Family.ID | Individual.ID | Paternal.ID | Maternal.ID | Gender | Phenotype | Population | Relationship |
|---|---|---|---|---|---|---|---|
| HG00096 | HG00096 | 0 | 0 | 1 | 0 | GBR | unrel |
| HG00097 | HG00097 | 0 | 0 | 2 | 0 | GBR | unrel |
| HG00099 | HG00099 | 0 | 0 | 2 | 0 | GBR | unrel |
| HG00100 | HG00100 | 0 | 0 | 2 | 0 | GBR | unrel |
| HG00101 | HG00101 | 0 | 0 | 1 | 0 | GBR | unrel |
| HG00102 | HG00102 | 0 | 0 | 2 | 0 | GBR | unrel |
Population codes
| Code | Population Description | Geographic/Ethnic Details |
|---|---|---|
| CHB | Han Chinese | Han Chinese in Beijing, China |
| JPT | Japanese | Japanese in Tokyo, Japan |
| CHS | Southern Han Chinese | Han Chinese South |
| CDX | Dai Chinese | Chinese Dai in Xishuangbanna, China |
| KHV | Kinh Vietnamese | Kinh in Ho Chi Minh City, Vietnam |
| CHD | Denver Chinese | Chinese in Denver, Colorado (pilot 3 only) |
| CEU | CEPH | Utah residents (CEPH) with Northern and Western European ancestry |
| TSI | Tuscan | Toscani in Italia |
| GBR | British | British in England and Scotland |
| FIN | Finnish | Finnish in Finland |
| IBS | Spanish | Iberian populations in Spain |
| YRI | Yoruba | Yoruba in Ibadan, Nigeria |
| LWK | Luhya | Luhya in Webuye, Kenya |
| GWD | Gambian | Gambian in Western Division, The Gambia |
| MSL | Mende | Mende in Sierra Leone |
| ESN | Esan | Esan in Nigeria |
| ASW | African-American SW | African Ancestry in Southwest US |
| ACB | African-Caribbean | African Caribbean in Barbados |
| MXL | Mexican-American | Mexican Ancestry in Los Angeles, California |
| PUR | Puerto Rican | Puerto Rican in Puerto Rico |
| CLM | Colombian | Colombian in Medellin, Colombia |
| PEL | Peruvian | Peruvian in Lima, Peru |
| GIH | Gujarati | Gujarati Indian in Houston, TX |
| PJL | Punjabi | Punjabi in Lahore, Pakistan |
| BEB | Bengali | Bengali in Bangladesh |
| STU | Sri Lankan | Sri Lankan Tamil in the UK |
| ITU | Indian | Indian Telugu in the UK |
PCA eigenvectors
| Individual | PC1 | PC2 | PC3 | PC4 | PC5 |
|---|---|---|---|---|---|
| HG00096 | -0.01032 | 0.0270 | 0.0117 | 0.0192 | 0.002517 |
| HG00097 | -0.01054 | 0.0275 | 0.0104 | 0.0180 | 0.003890 |
| HG00099 | -0.01067 | 0.0275 | 0.0104 | 0.0168 | 0.001831 |
| HG00100 | -0.00968 | 0.0275 | 0.0109 | 0.0191 | -0.000839 |
| HG00101 | -0.01038 | 0.0270 | 0.0116 | 0.0184 | 0.000796 |
| HG00102 | -0.01063 | 0.0272 | 0.0110 | 0.0178 | 0.003824 |
Scripts Overview
The process is currently set up in three scripts:
- pca_biplot_1kg.sh, pca_biplot_1kg_part2.sh, pca_biplot_1kg_part3_ggplot.R
- 1: Parallel processing (per chromosome) for the conversion of 1000 Genomes VCF files to BCF and subsequently to PLINK format. The script handles data normalization, ID reformatting, and variant pruning to reduce linkage disequilibrium, enhancing the quality of genetic association analyses.
- 2: Continues from Script 1, merging PLINK files across chromosomes into a single dataset, performing PCA to explore population structure.
- 3: Uses
ggplot2in R to visualize the PCA results, highlighting the population stratification among global populations. This script also integrates demographic data to color-code populations in the bi-plot, providing clear visual insights into genetic diversity.
Step-by-Step Summary
- Data conversion and normalisation
- Convert original VCF files to BCF using
bcftools, ensuring all variants have unique IDs based on chromosome positions. - Annotate and reformat using
bcftools annotateto adjust variant IDs. - Normalise and remove duplicate variants to clean the dataset for further analysis.
- Convert original VCF files to BCF using
- PLINK file preparation
- Convert BCF files to PLINK format, ensuring allele orders are maintained.
- Prune variants using PLINK to reduce the dataset based on minor allele frequency and linkage disequilibrium.
- Data merging and PCA analysis
- Merge all chromosome-specific PLINK files into a single dataset.
- Perform PCA to identify principal components that explain the maximum variance, indicative of population stratification.
- Visualisation and interpretation
- Use
ggplot2andpatchworkin R to create bi-plots of the first few principal components. - Overlay population data to visually interpret population structure and genetic diversity.
- Use
Conclusion
This reference panel and PCA analysis provide a framework for understanding genetic diversity and population structure within global populations, using the latest 1000 Genomes Project data. This methodological approach is essential for genomic studies requiring a comprehensive understanding of genetic backgrounds.